When performing experiments on surface conductivity, a material supplier found DOE software provided answers quicker and more efficiently.Conductive compounds such as plastic resins with carbon nanotube additives make it possible to combine static dissipation and electrostatic discharge (ESD) protection with the design freedom of injection molding. A significant challenge of implementing carbon nanotubes is that the injection molding conditions have a large effect on the resistivity of the finished product.
When performing experiments on surface conductivity, a material supplier found DOE software provided answers quicker and more efficiently.
Conductive compounds such as plastic resins with carbon nanotube additives make it possible to combine static dissipation and electrostatic discharge (ESD) protection with the design freedom of injection molding. A significant challenge of implementing carbon nanotubes is that the injection molding conditions have a large effect on the resistivity of the finished product.
The RTP Co. (Winona, MN), which compounds custom engineered thermoplastics, recently used design of experiments (DOE) to determine which injection molding process conditions would optimize conductive properties for a particular material. DOE made it possible to explore the complete processing space and provided users with a formula to calculate the conditions that would deliver the required resistivity levels. “The predictive capabilities of DOE make it possible to fully explore the processing window in only 32 runs,” says Ned Bryant, senior product development engineer at RTP.
|
A carbon nanotube loading of only 1%-4% provides a thermoplastic compound with a uniform surface resistivity of 104-109 ohms/sq (m, in, etc.). This level of loading also maintains the resin’s key physical properties, including ease of processing, shrink rate, impact strength, and surface finish. Carbon nanotube compounds provide a more uniform conductive surface and reduce the hot spots found with carbon-fiber-filled compounds.
These structures also enable thin-wall molds to fill at lower temperatures. Nanotube compounds are ideally suited for wafer processing, disk-drive components, and cleanroom applications. They are beneficial in automotive applications needing static discharge protection, such as fuel system components. Other automotive uses are body attachments such as mirror housings, door handles, and fuel filler doors, as well as wheel covers, bumpers, fenders, and interior parts.
Although the surface conductivity of finished carbon nanotube components is highly dependent on the processing conditions, molders often don’t have the time to run the many experiments normally needed to optimize surface conductivity. When RTP’s customers asked for guidance in this area, previously the compounder performed a series of experiments for customers that typically involved varying one factor at a time in order to evaluate its effect on conductivity. These experiments provided answers to limited questions such as, “What is the effect of mold temperature on surface conductivity with all other conditions held constant?”
The assumption was being made that mold temperature did not interact with any other variables, but these experiments did not determine whether or not this was actually true. These experiments were useful in solving limited questions in isolation. However, they did not address other important issues such as, “What are the best material processing conditions that will deliver the desired level of surface conductivity in the finished product?”
DOE software makes it easier, faster, better
More recently, RTP had begun using DOE to map out the complete processing space in order to enable processors to optimize molding conditions while taking into account second-order effects. DOE provides a solid estimate of the value of independent variables in every possible combination by varying the values of all the factors in parallel. This approach determines not just the main effects of each factor, but also the interactions between the factors. DOE also requires far fewer experimental runs than the traditional one-factor-at-a-time approach and makes it possible to identify the optimal values for all factors in combination.
“The statistical knowledge required to perform DOE from scratch can be an obstacle to its use,” says Bryant. “I save a considerable amount of time and aggravation by using Design-Expert software [from Stat-Ease Inc., Minneapolis, MN] to design and analyze the results of experiments. Design-Expert is easy to use yet can perform many different types of experiments. Matching the right experimental method to the problem at hand helps increase accuracy while reducing the number of required experimental runs.”
In a recent typical experiment, Bryant used DOE to determine the surface conductivity of an RTP electronics-grade polycarbonate/carbon nanotube compound over an extensive range of processing conditions. The goal was to help processors achieve optimal results with the material. The advantages of the new material include the ability to use thinner wall thicknesses and low specific gravity, both of which combine to reduce material costs by about 5%-plus. The new material also makes it possible to use lower processing temperatures, eliminates isotropic effects, allows use of regrind to lower material costs, and provides excellent surface appearance, according to RTP.
Bryant selected a fractional factorial experimental design that examines first- and second-order effects while requiring only half as many runs as a full-factorial experiment. With six factors to be evaluated, a full factorial experiment would require 2^6=64 runs while a fractional factorial requires only 2^6-1=32 runs. The factors evaluated in this experiment were:
A. Mold temperature (170°F-220°F)
B. Extruder barrel temperature (500°F-580°F)
C. Backpressure (1%-10%)
D. Injection speed (4-9 in/sec)
E. Hold pressure (10%-40%)
F. Hold time (6-15 seconds)
Design-Expert software generated the experimental design by specifying the conditions for each of the 32 runs based on the inputs provided by Bryant. RTP personnel then molded 3-by-5-inch plaques at each of the 32 run conditions and measured the corresponding surface resistivity with a Voyager test meter. Bryant entered the responses from the experiment into Design-Expert and the software performed statistical analysis.
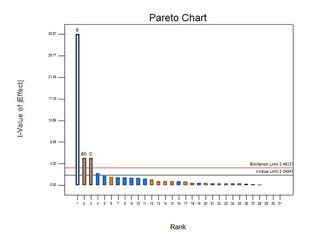
The Pareto chart pictured shows how much of the variability in the response can be attributed to each of the factors. The results show that the vast majority of the variability results from varying the extruder barrel temperature (B) and a lesser amount is due to the injection speed (D) and the interaction between extruder barrel temperature and injection speed (BD). The other four variables have minimal impact on the surface resistivity. “This information in and of itself was extremely important because it tells processors which variables they need to hold very precisely and which ones they can safely ignore,” Bryant said.
Design-Expert software also fit the data to an equation that predicts the value of surface resistivity for any values of the factors. The equation below can be used by processors to adjust processing conditions in order to obtain a wide range of surface resistivity.
Log surface resistivity = 53.75031
- (0.0837 x extruder temperature)
- (2.056 x injection speed)
+ (0.00411 x extruder temperature x
injection speed)
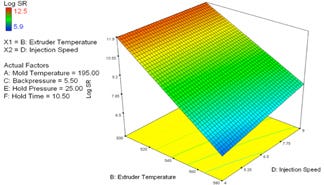
A response surface map (see illustration) shows how extruder temperature and injection speed affect surface resistivity. The interaction of the two variables is reflected in the curvature (twisted plane) of the graph. This type of graph provides an intuitive understanding of the effect of the factors on the response. It shows how a small change in extruder temperature has a big effect on surface resistivity, underlining the importance of holding this variable within tight limits. It also shows that as surface temperature is increased past 560°F and injection speed reduced below 5 in/sec, surface resistivity drops sharply as a result of a multiple-factor interaction.
“DOE helps our customers set their processing conditions to achieve the required levels of surface resistivity with our materials,” Bryant says. “It shows them which process conditions they need to focus on holding precisely and which ones they don’t need to worry about. DOE also provides significant statistical information that helps demonstrate its validity. We have been getting very positive feedback from our customers concerning our ability to provide these results. They appreciate getting the information and immediately understand its significance. They achieve better results faster and are more likely to use our materials.” —Jerry Fireman, edited by Rob Neilley
Jerry Fireman is president of marketing firm Structured Information (Needham Heights, MA).
About the Author(s)
You May Also Like


