One’s less expensive and simpler, but the other generates more comprehensive results. Which is right for you? The incorporation of fillers and reinforcements into both thermoplastic and thermoset polymers is an important route to modifying the properties of a given base polymer. The amount and type of filler has a significant influence on the final properties of the compound. Consequently, the filler content is an important aspect of quality control monitoring as well as a consideration in failure analysis programs.
May 21, 2009
One’s less expensive and simpler, but the other generates more comprehensive results. Which is right for you?
The incorporation of fillers and reinforcements into both thermoplastic and thermoset polymers is an important route to modifying the properties of a given base polymer. The amount and type of filler has a significant influence on the final properties of the compound. Consequently, the filler content is an important aspect of quality control monitoring as well as a consideration in failure analysis programs.
|
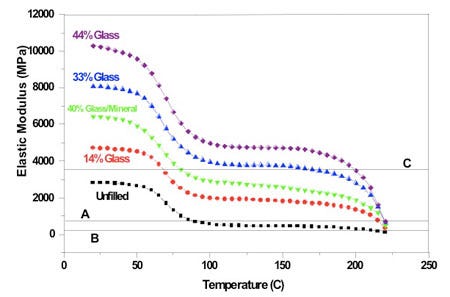
Figure 1 shows the dependence of modulus on temperature for five different grades of nylon 6. Note that the curves for all five grades have essentially the same shape. However, the actual value for modulus at any given temperature is dependent on both the amount and the type of filler used. Generally, the stiffness of the material increases with increasing amounts of filler. If we were to perform tensile tests on these five materials we would also observe that the strength of the material increases while the elongation at failure declines as toughness declines.
A close examination of the curves shows that the improvement in properties is not dependent merely on the amount of filler, but also on the type. A 40% glass fiber and mineral system, with actual proportions of 15% glass fiber and 25% mineral, does not provide as much of an increase in rigidity as a 33% filled material that uses only glass fiber. Fibrous materials, particularly when properly coupled to the polymer, provide true reinforcing qualities that offer a higher strength-to-weight ratio than a particulate like talc or calcium carbonate (CaCO3). However, mineral fillers tend to be less expensive and can reduce problems with warpage due to differential shrinkage in the flow and transverse directions.
Because filler content is an important aspect of composition, material suppliers will set minimum and maximum values around a nominal target. For example, a nominal 35% glass-filled material will typically have a tolerance of ±2-3% to ensure consistent performance of the material. The material supplier will perform periodic checks on the compound to monitor this parameter and processors also may wish to confirm the composition of the material that they are purchasing. In a case where a part molded in a filled material fails to perform as expected, the filler content of the molded part is likely to be part of the verification of composition that is always an important step in failure analysis.
Two types of analysis
There are two key methods that can be used to perform these measurements and they each have their advantages and disadvantages. One is a traditional ash test. This involves placing 2-3g of sample in a crucible and heating it in a furnace to a temperature sufficiently high to burn off all of the polymer. Most fillers are stable at temperatures well above that of even the most heat-resistant polymers and will remain as a residue. The mass of the residue divided by the mass of the original sample provides a simple measurement of filler content. The second approach uses a method known as thermogravimetric analysis (TGA). The principle of this test is the same as the ash test, but there are some important differences.
|
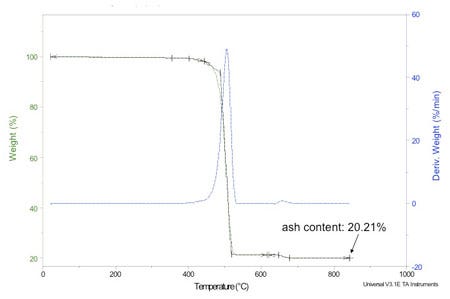
First, the TGA test is conducted at a programmed heating rate that is usually kept constant throughout the test. The data from the instrument is collected by a computer so that the weight loss process can be observed as a function of temperature. Figure 2 provides an example of the output from the test. The ash test may proceed by some series of steps of increasing temperature; however, the heating rate is not typically controlled or documented.
Second, a TGA pan holds a very small sample. Depending on the instrument and the preference of the technician, samples may be as small as 10 mg and rarely exceed 100 mg, as opposed to 2-3g used for the ash test. Finally, the two pieces of equipment come with very different price tags. TGA may cost 10 times more and requires more training; plus, it is a very delicate instrument that over its life will require more maintenance and upkeep than a simple muffle furnace.
The benefits of ash tests
So what are the merits and drawbacks of the two methods, and ultimately, which one is better? From an ease-of-use and capital investment standpoint, the traditional ash test makes more sense. The larger sample size provides greater assurance of sample uniformity, particularly important for raw materials, where the sample size for TGA may be a single pellet.
While we may like to think that every pellet of a glass-filled material contains exactly the same amount of glass, this is not the case. In one recent instance, TGA tests on single pellets of a nominal 20% glass-filled ABS varied 16-24%. This triggered a noncompliance on incoming inspection at the molder. However, ash tests performed on the same raw material, as well as the molded part, showed the material to be off by less than 1% from the nominal value.
Repeatability is also better in an ash test when the filler constitutes a small amount of the formulation. For example, inorganic pigments like titanium dioxide can be characterized because they are very stable at elevated temperatures. Typical pigment loadings in a polymer may be as low as 1-2%. With such low target loadings, the very small samples used for TGA are likely to produce standard deviations in measurement that are relatively large compared to the nominal value.
The table below shows a comparison of ash and TGA tests performed on an acrylic formulated to provide a translucent appearance by carefully controlling the level of white pigment. The end user sought to create a correlation between pigment loading and light transmittance. While both methods produced a satisfactory correlation, the data scatter from the TGA tests was too large to provide reliable repeatability without routinely performing multiple tests, while a single ash test proved to be adequate for ongoing quality control purposes.
TGA’s advantages
Given the relative simplicity and low cost of the ash test apparatus coupled with these advantages, it would seem to be the clear winner in any decision related to selecting instrumentation for filler content measurements. However, TGA provides some powerful capabilities that the ash test cannot duplicate. 
First, some fillers and reinforcement are not stable at the typical test temperatures used to assess filler content. Examples are aramid, CaCO3, and the various forms of carbon such as graphite and carbon fiber. Aramid and carbon are essentially organic and therefore subject to decomposition at a temperature range similar to that of many polymers when tested in an air atmosphere.
TGA instruments have the ability to control the test atmosphere, using an inert gas for some parts of the test and oxygen or air in other parts in order to orchestrate the decomposition of various ingredients at different points in the test. The ability to plot these weight losses as a function of temperature allows for confirmation that certain components have been removed before others begin to decompose.
CaCO3 can be particularly tricky when using a traditional ash test. The carbonate portion of the molecule will decompose at 650-675°C to form carbon dioxide, leaving calcium oxide as a residue. In a pure CaCO3, 56% of the filler remains as ash and the remaining 44% is lost. Since most ash tests are performed at maximum temperatures of 700-850°C, some or all of the CaCO3 is likely to be converted during the test. Weighing the residue will consistently give a false low reading for the filler.
If the analyst knows that CaCO3 is present and that it is pure, this ratio can be used to correct the ash content for the partial weight loss. However, CaCO3 is frequently mixed with other more thermally stable fillers such as talc. In such a system, the traditional ash test will have little chance of quantifying the various fillers in the mixture, while the TGA test will be perfectly suited to the task.
TGA also has the advantage of being able to quantify the presence of some polymeric modifiers. PTFE is more thermally stable than most polymers and will therefore decompose at much higher temperatures than the materials to which it is added. By TGA, this ingredient will usually appear as a separate and distinct weight loss while in an ash test it will simply disappear with the rest of the organic materials.
The ability to graph weight loss as a function of temperature also allows for confirmation that the weight loss process is complete. One of the mistakes made when performing traditional ash tests is failure to burn off all the organic material. Some polymers like PE and PP undergo complete decomposition in a single step. However, some materials like PC and PPS produce a significant amount of carbon char during the initial stages of decomposition. This char is more thermally stable and can take considerable effort to remove.
Often, in an effort to move a certain number of samples through what is considered to be a routine test, the analyst will not carefully inspect the ash for signs of residual carbon and may end up quoting a high filler content because of incomplete decomposition. The TGA, with the ability to graph the weight loss process, will clearly show whether or not the sample achieved a stable endpoint.
Finally, ash tests are often seen as a faster way to achieve the filler content measurement; often two or three samples can be loaded into the furnace at once while the TGA runs samples one at a time. However, a properly run ash test will usually take about the same amount of time as a TGA. Attempts to heat samples too rapidly in the furnace can result in the loss of small filler particles from the crucible, so a measured approach is advisable.
While TGA may still consume more time per test, instruments built in the last 10-15 years can be outfitted with an auto sampler that can allow the analyst to stage enough samples to run unattended for hours or even days. This streamlines the testing process and frees up the most valuable asset in the lab, the analyst, for other tasks. It also keeps the instrument productive in a lights-out situation.
When selecting the appropriate tool for determining filler content, there are obviously a number of factors to consider. In an ideal situation, both TGA and a traditional furnace are available to the analyst since they each have strengths that make them useful. Ultimately, each operation needs to consider the types of compounds they are working with and the level of detail they expect from their selected techniques.
About the Author(s)
You May Also Like


