May 29, 2000
|
This series of articles is designed to help molders understand how a few analytical tools can help diagnose a part failure problem. Michael Sepe is our analyst and author. He is the technical director at Dickten & Masch Mfg., a molder of thermoset and thermoplastic materials in Nashotah, WI. Mike has provided analytical services to material suppliers, molders, and end users for 15-plus years. |
Breaking down the composition of a molded part or a raw material is one of the most common requests we receive. A sudden decline in product performance, sketchy details on a request for quote, or the desire to know what a competitive product is made from are all reasons for ordering this type of test. When a client asks for this type of assistance, the depth of the information can vary from a simple determination of the polymer to a more detailed breakdown of fillers, pigments, and other additives. In this article we will focus on the problems associated with identifying the polymer and next month we will take up the subject of the remaining ingredients.
When identifying the type of polymer used in a compound, there are three major techniques that are particularly helpful. These are differential scanning calorimetry (DSC), thermogravimetric analysis (TGA), and infrared (IR) spectroscopy. They produce results rapidly, require very small sample sizes, and in the case of IR, can be completely nondestructive. The problem is that not all of these techniques will produce the desired result; success depends greatly on selecting the right approach. Keeping analytical costs down depends upon selecting the best approach the first time. Good background information from the client is helpful in this effort.
Each of these techniques has its strengths, and in determining the composition of the polymer the task is to highlight properties and behavior that are distinctive.
DSC identifies the temperature at which important phase changes such as melting, recrystallization, and glass transition occur. If a wide variety of materials have similar transition temperatures, this may not be the best approach to the problem.
TGA focuses on the manner in which a material decomposes. It has the advantage of being more quantitative than DSC or infrared, but only if it is possible to decompose a material completely before something else in the compound begins to react.
|
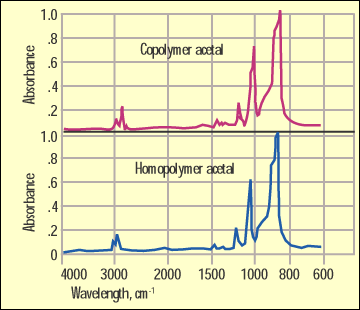
Figure 1. IR comparison of homopolymer and copolymer acetal. |
|
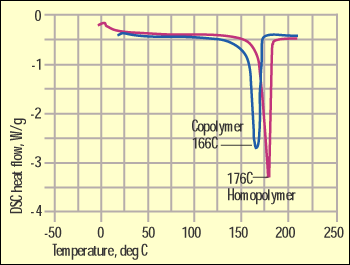
Figure 2. DSC comparison of homopolymer and copolymer acetal. |
IR looks at the basic chemical bonds that make up the polymer molecule. Two materials may have very different physical properties, but if the bonding in them is the same then they will not appear to be different by infrared spectroscopy.
Keeping analytical costs down depends upon selecting the best approach the first time. |
It is also important for potential clients to understand that no one analytical laboratory contains all the testing equipment that exists. Just as processors have a finite number of dollars to spend on processing and secondary equipment, laboratories have to decide between the wide array of analytical tools based on what they perceive to be their clients' needs over the years. As an analyst becomes particularly comfortable with a certain tool, he or she may tend to become over-reliant, stretching it into areas where its usefulness is sometimes questionable. We all have this tendency whether we like to admit it or not, and it is important to maintain an awareness of the other tools that are out there so that the client is best served.
|
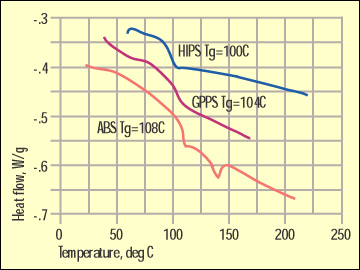
Figure 3. Glass transitions for ABS and polystyrenes. |
The virtual partnership is a key to this broader awareness. It may not be possible to house everything within the four walls of a given company, but it is possible to collaborate with the planet's best to draw in the needed expertise. Only by utilizing a particular technique is it possible to become fully aware of its power.
Infrared Spectroscopy
IR is a workhorse for organic chemists. Since polymers are organic materials, it follows that this would be a useful tool for examining the structure of these substances as well. But there are times when important changes in structure are transparent to the infrared technique. Figure 1 shows infrared spectra for an acetal homopolymer and an acetal copolymer. This is a distinction that can have great importance to the success of an application, but as you can see from this illustration, the infrared spectra of these two materials are essentially identical.
|
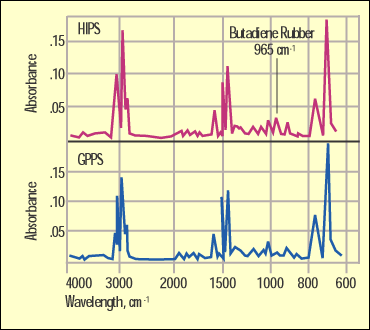
Figure 4. Infrared spectra comparing GPPS and HIPS. |
The same problem will occur when comparing low-density polyethylene to high-density polyethylene, PET polyester to PBT polyester, or various nylon materials such as nylon 6 to nylon 6/6. (This last example does not extend to the newer polyphthalamides, which do contain distinctive bonds that do not appear in most nylons.) While there are important structural differences between the materials in all of these comparisons, the chemical bonds within the molecule are the same and distinctions cannot be made readily with this technique. This is an important point because many processors use infrared spectroscopy as the sole incoming inspection tool for resin quality control. But important changes in structure and even molecular weight can go undetected by infrared.
|
Figure 5. Infrared scan of ABS. |
Some analysts who are especially familiar with a particular class of materials can make a case for looking at certain characteristics of a spectrum to determine a key difference. But this often involves pointing to fine details in samples where the composition is already known. This is very different from being confronted with an unknown and having to make the prediction without the benefit of prior knowledge.
IR vs. DSC
There is no need to pore over questionable differences in the IR spectrum when an alternative technique is much more efficient. In all of the comparisons cited above the materials are semicrystalline in structure and therefore have distinct melting points. Since DSC is designed to determine these melting points, it is a logical alternative that can provide the necessary detail. Figure 2 shows a DSC scan comparing the same acetal materials illustrated in Figure 1. Here the differences are obvious. The homopolymer has a higher degree of structural order that results in not only a higher melting point but also a higher heat of fusion.
Now for the flip side of this picture. Amorphous materials have no well-defined melting point. Instead, they soften as they pass through the glass transition. This is an event that can be measured by DSC but is far less energetic than a melting point. More importantly, a lot of polymers have glass transition temperatures in the same general temperature range.
Figure 3 shows glass transitions for a general-purpose polystyrene (GPPS), a high-impact polystyrene (HIPS), and an ABS. Now, a manufacturer of DSC equipment might try to convince a prospective customer that these differences of 4 deg C are distinctive and sufficient to distinguish between these materials. But such variations can be typical of lot-to-lot variation or even the result of a particular thermal history.
In addition, these are just a few of the many polymers that have a glass transition temperature in this region. Some grades of PPO/polystyrene, SAN, and many acrylics will also appear in this temperature region. Here infrared is invaluable because all of these materials contain chemical bonds that make them unique.
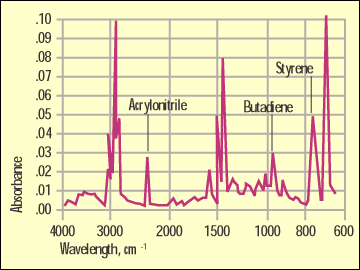
Figure 4 shows a comparison of the GPPS and the HIPS by infrared. While they are very similar because they share a lot of the same bonding, the butadiene rubber in the HIPS has a distinctive absorption at 965 cm-1 that will not appear in the spectrum of the unmodified material. Figure 5 shows a spectrum of the ABS and highlights another detail that the DSC cannot pick up. The sharp peak at 2240 cm-1 is distinct to a bond in the acrylonitrile.
|
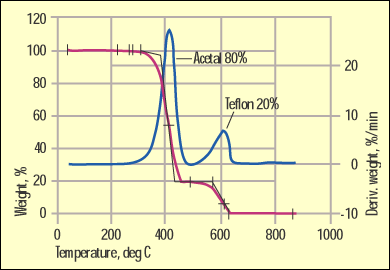
Figure 6. Acetal and Teflon separation by the TGA method. |
TGA vs. DSC
Previously, we mentioned that TGA was useful because it deals quantitatively with the weight losses due to decomposition. In this respect it has an advantage over both DSC and IR where quantitation requires multiple standards for comparison. TGA is frequently ineffective in picking out different polymers in a compound because many materials decompose over the same general temperature range. Even in a polymer blend where a substantial amount of two or more polymers is present, an exact breakdown can be difficult because the decomposition patterns overlap.
But on occasion we get lucky. One of these instances involves acetal materials modified with PTFE (Teflon). Figure 6 shows a TGA test result for this popular bearing material. The weight loss and the weight loss rate are both shown to highlight the composition of the material.
Acetals have one of the lowest levels of thermal stability of any commonly used commercial polymer. As a result they decompose at a relatively low temperature. PTFE resides at the other end of the thermal stability spectrum. It is possible, therefore, to separate these materials fully by TGA.
Important changes in structure and even molecular weight can go undetected by infrared. |
More importantly, the weight losses automatically provide the exact composition. The presence of PTFE in acetal can certainly be detected by infrared. But quantifying the PTFE would involve a laborious comparison of the intensity of certain absorption bands with standards of known composition that are frequently not available. And even then sample preparation can cause errors to creep into the calculations. Again, it is not a matter of what is possible; it's a question of what makes the most sense in solving the specific problem.
And what about DSC? If you have been following this series you may remember that PTFE is a semicrystalline material with a melting point of 325 to 330C and that we have used DSC to detect its presence in PPS bearing grade materials. Why not perform the same test to highlight the presence of PTFE in acetal? First, if you look at those earlier articles you will notice that we never drew quantitative conclusions about the PTFE content in those PPS materials, but instead focused on relative measurements. This is because an exact measurement would again require known standards for comparison. But even if this requirement could be satisfied, there is another problem that makes the DSC technique ineligible.
As we mentioned, the thermal stability of acetal is limited. This is no secret to anyone who has processed this family of materials. If you look carefully at the TGA scan in Figure 6 you can see that the weight loss process for the acetal phase begins below 300C. In the DSC the energy associated with this weight loss is strongly endothermic, which means that the heat flow curve trends down in the same manner as when a material melts. By the time the temperature in the DSC reaches the melting point of PTFE, the melting event is overwhelmed by the energy associated with formaldehyde formation from the acetal decomposition. This is one of those practical limitations that interferes with a theoretically sound approach. For this particular case, the TGA stands out as the method of choice for fast, accurate, and cost-effective results.
This month we have provided some practical guidelines for how to approach the deformulation of the polymer in a compound. Of course no single technique fits every situation. This principle is even truer for the analysis of the other ingredients that may show up in a compound, which we will discuss next month.
Contact information |
You May Also Like

