The plastics industry relies upon antiquated color space calculations and tolerancing schemes to determine color quality, wasting time and resources.
January 4, 2021

Earl Balthazar
There is increasing crossover between plastics and textiles, particularly in the apparel and footwear sectors where these two materials intersect in new and ever-ubiquitous ways. Despite this widespread integration, the plastics industry lags alarmingly behind textiles when it comes to one important factor — color tolerancing. That is because the plastics industry relies upon antiquated color space calculations and tolerancing schemes for determination of color quality, such as CIE 1976 DE* (spherical tolerancing), which does not agree with visual assessment.
This greatly impacts color development and matching capabilities, leading to production inefficiencies and other challenges. In order to keep up with the times and rectify these color shortcomings, the plastics industry would be wise to standardize the use of the CMC or CIE2000 DE* formulas. Although a change of this magnitude would be challenging, the transition would alleviate many of the shortcomings inherent to older color space calculations for Delta E, while also increasing efficiencies, saving time, and reducing waste.
How we describe color.
In order to fully understand the shortcomings of a particular color tolerancing formula, it is essential to understand how it compares with other tolerancing schemes and what its relationship is to visual assessment. In order to do this, one first needs to understand how color is described and defined.
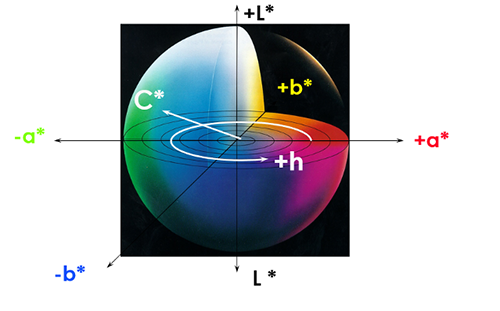
When managing color, there are a variety of systems that mathematically describe colors. Defining color begins with a color space — a three-dimensional model describing a set of colors mathematically in relationship to each other. Colors are mapped along axes that represent different aspects of color such as hue or saturation. The mapped aspects vary depending upon the type of color space. This helps to locate a color within that color space. In many ways, it is akin to identifying a location within the world using latitude, longitude, and altitude. CIELabCH is the color space of current importance.
|
CIELAB color space. |
CIELabCH (CIEL*a*b* or L*C*H*)
Color spaces have continued to be refined over the years, with the last notable refinement being CIELabCH, which was defined in 1976. The breakthrough with this iteration is that the space between colors was mapped out for better definition of visual differences. CIELab expresses colors according to three opponent-color values, which include:
L*: light/dark, from black (0) to white (100)
a*: red (+) / green (-)
b*: yellow (+) / blue (-)
|
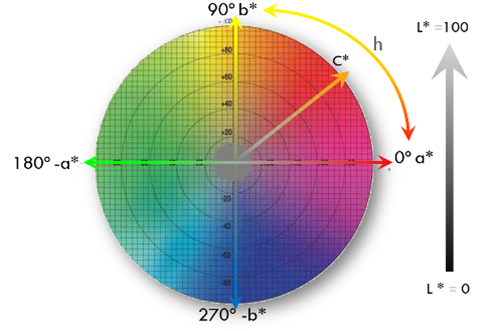
CIELabCH color space. |
These are often referred to as rectangular coordinates. CIELCH values can be referred to as polar coordinates, with these definitions:
L*: as specified above
C*: + = stronger, - = weaker
H* (arctan of h): + = counter-clockwise
The difference, or “distance,” between colors within CIELab is defined as Delta E (DE*). That calculation is basic Euclidian geometry, being the square root of the sum of the squares of the ΔL*, Δa*, Δb* values, describing the distance from the standard to the sample.
Having established a color space, the next — and most critical — variable is color tolerancing. Tolerance defines an acceptable level of difference between a color sample and the standard. Essentially, it is a numerical value that defines what you will accept or reject. These color tolerances are defined as regions within the color space, which can be shaped differently depending on the tolerancing scheme.
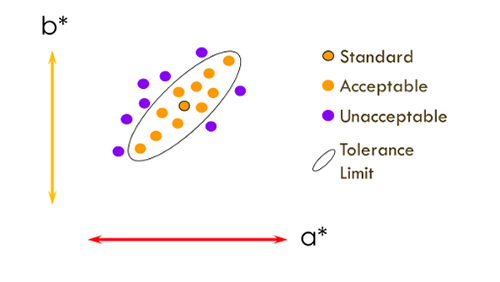
There are multiple tolerancing methods, with each tolerancing equation producing a different shaped “tolerance region.” They can be rectangular, spherical, conical, or ellipsoid. Ellipsoid is preferable; however, the best tolerance regions are defined when you can affect the size and shape of the ellipsoid to correspond to what is visually acceptable based upon its position within color space. For example, white and pastel colors have different perceptibility/acceptability levels vs. deep and high chroma colors. Humans are very sensitive to changes in hue, particularly in white and pastel colors, meaning we can spot these variations much more easily.
The following maps the evolution of modern color tolerancing methods and their various strengths and shortcomings.
Delta-L*a*b* or Delta L*C*H*
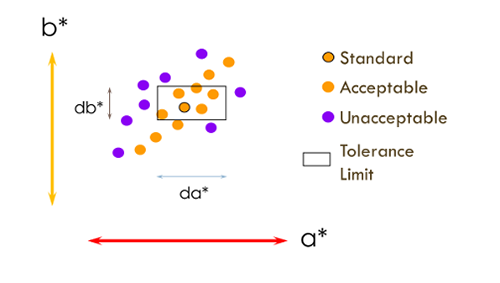
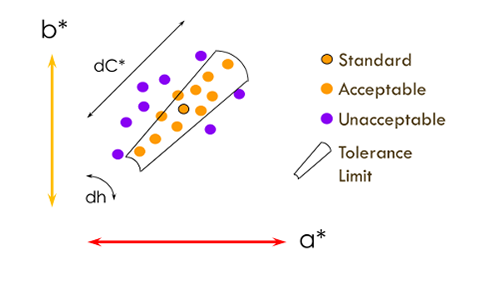
This is one of the earlier tolerancing schemes that produces a rectangular or conical tolerance region. Use of Delta-L*a*b* creates challenges for those managing color: If you want to keep “bad” materials out, you need to reduce the size of the tolerance region to the point where you inevitably also end up tossing out good materials, or doing visual overrides of the numerical results. It is a wasteful and inefficient process. Delta L*C*H* is a better means of describing a tolerance zone, but it is difficult to use LCH numbers to communicate what is wrong with a color, making it impractical to use.
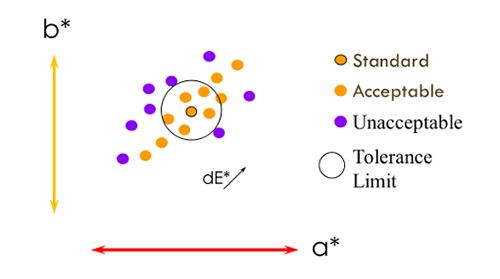
The following images illustrate the differences between square, spherical, and ellipsoid tolerance regions. They help illustrate how good color can easily be outside — and bad color easily inside — of the range defined by square and spherical vs. ellipsoid.
|
Numerical tolerance: Lab |
|
Numerical Tolerance: LCh. |
CIE 1976 DE* (CIE DE*)
The next usage is CIE DE*, which is basically a spherical tolerance zone of a specific radius that does not change with the color. As with the rectangular tolerance zone, the spherical tolerance does not accurately reflect how humans judge color, thus resulting in the same shortcomings as ΔL*a*b*.
|
Numerical tolerance: dECIE. |
CMC
The problems with the CIELab DE* calculation were recognized immediately. CMC was an improvement upon that tolerancing scheme because, in using the CIEL*C*H*, it introduced an ellipsoid shape that changed size depending upon its placement within color space. For example, if you place a tolerance region in a green vs. a white area of color space, the shape of the tolerance zone will adjust itself to accommodate where humans would be more or less sensitive to color variation. This tolerance finally started to better match up with human visual assessment of colors and provided better agreement with the human observer.
|
Numerical tolerance: dECMC. |
CIE2000
This formula was a further improvement upon CMC that uses an improved DE* calculation to bring color differences closer to what the human eye actually perceives. It is currently the industry gold standard. The leaders in color management technology recommend use of this metric.
Plastics industry is falling behind.
If the CIE2000 DE* is the industry gold standard, then why are plastics manufacturers still relying on CIE DE*? In the textile industry, manufacturers and brands have primarily adopted the newer color spaces that better agree with visual assessment (CMC and CIE2000). So, why hasn’t plastics caught up? In many ways, the answer is simply that change is hard. It can take a long time, and it relies upon multiple parties coming together to execute change.
When plastic color houses and compounders first made the move from visual color matching and quality control using colorimeters to modern color management techniques using spectrophotometers, CIE DE* was the gold standard. As such, CIE DE* was adopted across plastics manufacturers’ standards, written into quality plans, and defined in customer contracts. That is a challenging thing to change, even in spite of the evidence supporting the transition.
The problem with holding on to CIE DE* throughout the industry is that manufacturers cannot rely on their numerical tolerancing, and that is the primary purpose of having tolerancing in the first place. The intent of these formulas is to move away from human intervention and visual color assessment, and human subjectivity that is inherent in this process.
Tolerancing schemes like CIE DE* only work effectively if you can shrink the tolerance region — the sphere — down to a size where it eliminates any visually unacceptable results. This is incredibly inefficient and wasteful, because it also eliminates batches outside of the numerical value that are visually good. In most cases, this leads to human override of the numerical results.
Think of the tolerance region like a ball. DE 1.0 is the size of a beachball, which includes good and bad numerical tolerances when you use CIE DE*. If you shrink down that tolerance region, some manufacturers will need to reduce it to the size of a golf ball simply to ensure no batches go through that do not meet acceptability. Because of this, CIE DE* is no longer relevant. In fact, the plastics industry is being hobbled by its own tolerances and subsequently is wasting valuable time and resources.
Notably, it is impossible to convert one color system to another. This means that the degree of color variation measured with one metric cannot be accurately compared with measurements from another. As such, the industry would need to fully commit to transitioning to a modern-day tolerancing scheme like CIE2000.
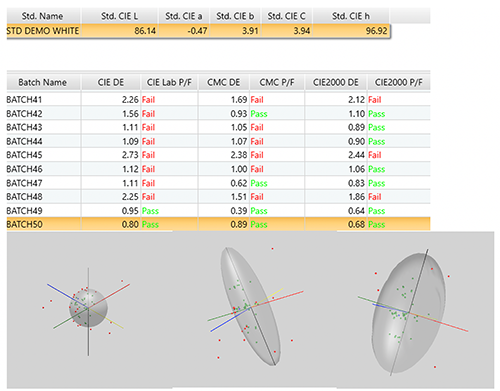
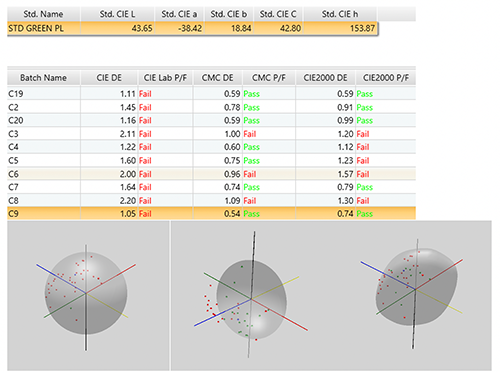
In order to make the transition and adopt a modern color formula like CIE2000, plastics manufacturers, masterbatchers, color compounders, and the rest of the industry will need to commit to the change. A good place to start is a comparative analysis of CIE DE*, CIE2000 DE*, and CMC DE*. In the examples below, the numbers speak for themselves. These comparisons should then be presented to customers, to ensure they are supportive of the transition and understand that it will not impact quality. In fact, it may actually end up improving quality.
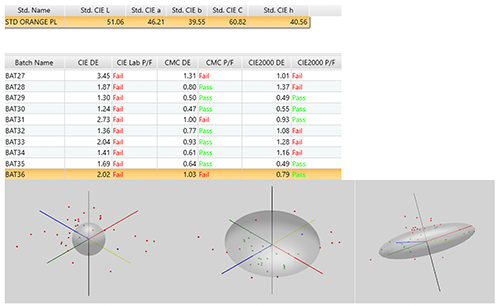
In these examples the single number DE* for all three calculations — CIE DE*, CMC DE*, and CIE2000 DE* — are illustrated for various colors, along with the graphical representation of their tolerance zones for a DE* of 1.0.
For a white:
|
For a dark green:
|
For an orange:
|
The plastics industry would greatly benefit from adopting and standardizing the use of CIE2000 for color tolerancing. In today’s competitive market, there is little room for waste — whether it is time or resources — and that is ultimately all that antiquated color formulas like CIE 1976 DE* can contribute.
About the author
Earl Balthazar is a Senior Application Engineer and has been a member of the Datacolor team for more than 15 years. He is a color technologist with a background in color science, human color perception, and industrial applications of color, and has experience as a color matcher, lab manager, and tech service specialist. Outside of Datacolor, Earl sits on the Board of Directors for the Society of Plastics Engineers, Color and Appearance Division, where he has been a member for over 30 years.
Datacolor is a global leader in color management solutions and provides software, instruments, and services to ensure accurate color of materials, products, and images. The world’s leading brands, manufacturers, and creative professionals have used Datacolor’s innovative solutions to consistently achieve the right color for more than 50 years. Industries served include textile and apparel, paint and coatings, automotive, and plastics, as well as photography, design, and videography. For more information, visit datacolor.com.
You May Also Like
