Once again, the numbers on data sheets provide an inaccurate picture of how a material will function once processed.When products fail to perform as expected, the root cause lies in one of five key areas: material selection, part design, mold design, processing, or validation. Attention to detail in the first four of these has been the cornerstone of the message that Glenn Beall has delivered to the industry for many years. The fifth has been articulated by Zan Smith and refers to the testing and qualification stage of product development.
July 13, 2009
Once again, the numbers on data sheets provide an inaccurate picture of how a material will function once processed.
When products fail to perform as expected, the root cause lies in one of five key areas: material selection, part design, mold design, processing, or validation. Attention to detail in the first four of these has been the cornerstone of the message that Glenn Beall has delivered to the industry for many years. The fifth has been articulated by Zan Smith and refers to the testing and qualification stage of product development.
|
Establishing test conditions that accurately capture the expectations for a product over its intended life is critical. If these test conditions are overly stringent, the product will fail in testing. The result is usually increased costs and late product introduction as unnecessary design changes are made and more costly materials are employed. If the test conditions are too lax, then the product will fly through the qualification process only to fail in the field.
The setup
This case study involves a limited number of failures in a small gear and provides some valuable insights into the interactions between material selection, part design, and processing. It also illustrates that often problems exist in more than one of the five disciplines, and that frequently a product can withstand mistakes in one of these areas but may not be able to survive oversights that involve two or three.
The failure mode in this part was a crack through its wall from the inner to the outer diameter. The hole in the molded gear accommodated a metal pin that was inserted and retained with a press fit. The parts were molded from an unfilled acetal homopolymer and the few that failed had been in service for 1.8-2.3 years. A review of the design history of the part showed that all of the failed parts were produced at a time when the dimensional tolerances of the molded hole and the inserted pin resulted in a potentially elevated hoop stress compared to product made later in the product life cycle. Nevertheless, a lot of parts had been molded with this configuration and the number of failures was relatively small compared to the total volume produced. This suggested that other factors had changed.
The application environment temperature was relatively mild, averaging about 35°C with fluctuations between 25°C and 50°C. The company molding the gear was competent and very knowledgeable in the areas of process control and optimization for semicrystalline materials used in gear applications. The material was closely specified to be a particular grade sourced from a single resin supplier that synthesized the polymer. So manufacturing variations that can arise due to multiple sources of raw material was not a factor. But the failure rate was high enough to warrant a root cause analysis.
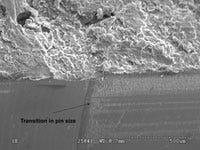
A microscopic evaluation of the fracture showed that it originated from the inner diameter of the molded hole and extended relatively slowly to the outer diameter. High magnification images of the origin area confirmed that a step in the molded hole resulted in a greater level of interference between the hole and the inserted pin where the diameter of the hole was reduced. The reduction was only 0.0015 inch (0.038 mm). However, this represented a change of more than 1% in the hole diameter.
|
The image in Figure 1, taken at 100X, shows the transition in the diameter of the hole. The increased level of abrasion on the molded surface attests to the greater interference between the molded hole and the pin at the point where the hole became smaller. This transition was also determined to be the origination point for the fracture. Figure 2 shows the same transition at 500X. This gives an enhanced view of the displacement of plastic by the inserted metal pin as it passed through this step transition.
This obviously results in an increased level of stress. The problem now focused on what that stress level might be in a worst-case scenario where the tolerance stackup between the pin and the hole produced maximum interference. This is where the finite element analysis (FEA) specialists come in. By modeling the interference, some assessment of the constant stress on the inner diameter of the part can be made.
The analysis
FEA is a wonderful tool. But like all simulation tools, it relies on accurate inputs and a treatment of properties that is consistent with the behavior of the material. There are many factors that can prevent an FEA from providing an accurate assessment of how a plastic part will perform in a particular environment, and many of these go beyond the scope of this article. However, there are two key factors that are essential to address here: 1) the lack of accurate material properties at application conditions; and 2) the failure of the analyst to treat plastic materials as viscoelastic systems. The two problems are related, because in order to perform an accurate treatment of viscoelastic behavior, the analyst must have performance characteristics that capture the dual effects of time and temperature when the material is under load.
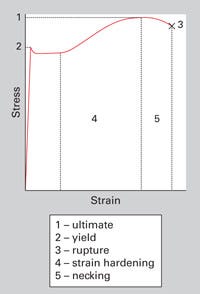
When performing an FEA, the analyst has a choice between performing a linear or nonlinear analysis. Linear analysis is appropriate for metals since they exhibit elastic behavior up to or very close to the yield point as shown in the stress-strain curve for aluminum provided in Figure 3. In addition, the shape of this stress-strain curve is relatively consistent across a broad temperature range.
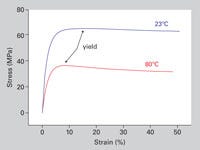
However, polymers do not behave in this manner. Figure 4 shows stress-strain curves for an unfilled acetal at room temperature (23°C) and at 80°C. The increase in temperature has an obvious effect on the shape of the stress-strain curve and on a lot of the key properties that we derive from these curves. These key properties, such as yield strength, elongation at yield, and modulus, are attributes of the curves that are summarized in a standard data sheet. But the data sheet treatment tells us nothing about the shape of the curve.
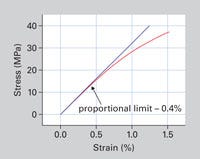
One of the properties typically provided on the data sheet is the strain or elongation at yield. At room temperature this value for the acetal material shown in Figure 4 is approximately 15%. But the stress-strain behavior of the material is not linear up to that point. A visual evaluation of the stress-strain curve might suggest that nonlinear behavior begins at a strain level of approximately 2%. However, a close look at the initial stages of the curve, provided in Figure 5, actually shows that the last point where stress and strain are related in a linear fashion occurs at a strain of 0.4% associated with a stress level of 12.8 MPa (1850 psi).
This is a long way from the yield stress of 65.4 MPa (9500 psi) that is provided on the data sheet. The modulus will be quoted as 3200 MPa (464,000 psi). This is the value for E that will be plugged into the FEA in equating stress to strain. In a linear analysis it will be applied without regard for the shape of the stress-strain curve. But it is only applicable to a very small portion of the stress-strain curve.
The answer
The consequence of using linear analysis in modeling the response of plastic materials to a stress state is that the real relationship between stress and strain is not accurately captured if the proportional limit is exceeded. This often leads to a drastic overstatement of the real stresses because linear analysis assumes that the stress-strain curve is linear up to the yield point. In the case of this material, a 1% strain will equate to a stress of 32 MPa (4640 psi) in a linear analysis while a nonlinear analysis will give a stress of 28.5 MPa (4130 psi). The farther we travel up the stress-strain curve, the greater the error becomes between the calculations of the linear model and actual behavior of the material.
Linear analysis is typically used because it is easier to perform. But the result is often a drastic miscalculation of the stresses. This was exactly what happened when the stresses were modeled for the gear. The calculated stress supposedly present in this design was nearly 10,000 psi. If this were really the case, the part would obviously not have lasted two years. Instead it would likely have failed on the assembly line the moment the pin was inserted into the hole or very soon thereafter.
In this case, we were aided by the fact that the load-bearing properties of this particular material had been characterized at a wide range of time-temperature scenarios. So when the FEA results were generated, they could be compared not only to the short-term properties provided by the data sheet but also to an enhanced map of time-temperature responses that included the time frame of the failures and the application temperature for the part. This is a crucial step in determining the contribution of the design to the failure. The process of developing that information and applying it to the problem will be our topic in Part 2.
About the Author(s)
You May Also Like

