Correct conclusions as to the source of problems in a molded part require good data on material behavior over time, but who has time?
July 30, 2009
Correct conclusions as to the source of problems in a molded part require good data on material behavior over time, but who has time?
In the first installment of this study, we established that a limited number of small gears molded from an acetal homopolymer had failed after approximately two years in service at application temperatures between 25°C and 50°C. The failures were related to a period of time when the interference fit between the inner diameter of a hole in the center of the gear and the outer diameter of a metal pin inserted into the hole produced a higher level of stress due to a step in the molded hole. SEM images confirmed that the failure had initiated at the inner diameter of the gear and that the initiation site coincided with the step. At this point, all of the attention had been placed on the design of the part and the assembly.
|
Changes had already been made to the degree of interference in the assembly. Now the design engineers wanted to determine the stress levels on the plastic associated with the old and the new design. Finite element analysis (FEA) is the tool used to make this determination. However, accurate FEA work in plastic materials is hampered by a lack of good property data that take into account the combined effects of stress, time, and temperature. This lack of data and a greater familiarity with metals causes many analysts to use simply the short-term properties from the data sheet and assume linear elastic behavior up to the yield point.
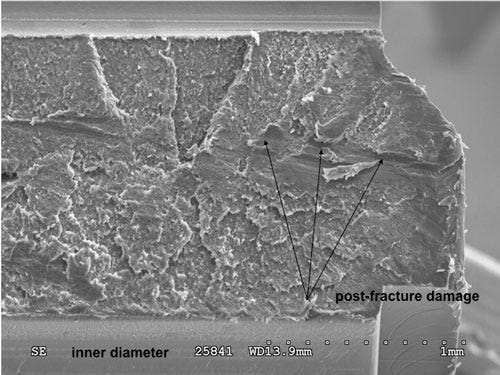
In this case, this practice resulted in a stress calculation for the older design of 10,000 psi. This exceeded the yield point of the polymer even at room temperature and would have resulted in almost immediate failure rather than a two-year life. However, the microscopy performed on the fracture confirmed that the crack had traveled slowly through the wall of the part. One of the clues to this slow crack growth process is the presence of a significant amount of post-fracture damage as shown in Figure 1. This damage occurred after the crack had initiated but before the unit failed outright. This shows that the assembly continued to function for a period of time after the crack had extended partially through the wall.
Accelerated testing
Naturally, the design change to the molded hole had reduced the stress on the gear. But the FEA calculation continued to show stresses near 6000 psi. This raised concerns that while the product was improved, failures could continue to occur in the product over a more extended time frame that might take several years to unfold. There was a significant need to obtain good engineering data on the behavior of this material as a function of time and temperature. This would provide a reality check on the types of stresses that were actually being generated on the parts in service and it would also allow for the construction of accelerated tests that would produce failures in a relatively short period of time. With an established quantitative relationship between time, temperature, and stress, these short-term results could be extrapolated to anticipated performance at actual application conditions.
|
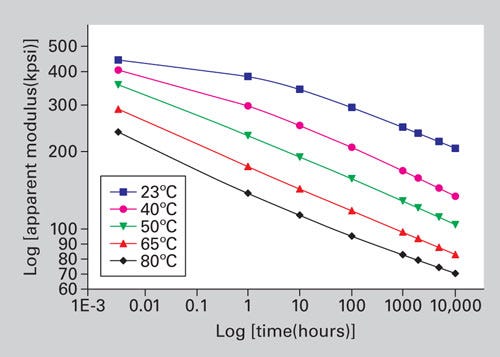
The techniques used to provide these data have been addressed in detail in past articles that discussed the phenomenon of creep. They involve performing a series of short-term creep tests over a temperature range that includes both the temperatures of interest and higher temperatures that allow for the establishment of an equivalence between time and temperature. The product of this exercise is a series of plots of apparent modulus, often referred to as creep modulus, at a variety of temperatures that can be extended out to the desired time frame for an application.
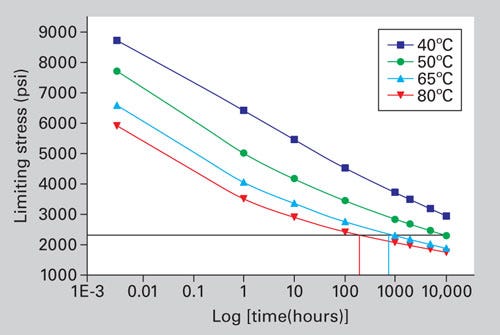
Figure 2 shows the results of this characterization for the acetal homopolymer of interest. These results are then combined with stress-strain curves generated at each of these temperatures. These curves allow for an accurate assessment of the nonlinear behavior that is so important to an accurate picture of long-term performance in plastic materials. These data can be presented in any number of ways. Figure 3 shows calculated maximum allowable stress levels for this material at several temperatures as a function of the desired lifetime of the product.
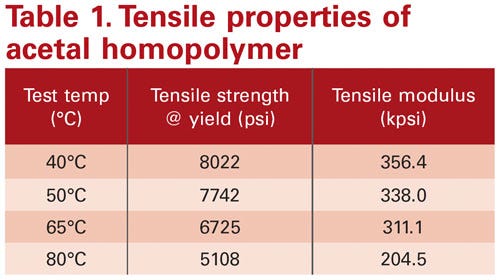
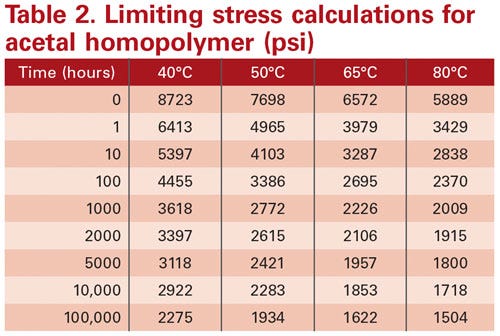
Table 1 shows the tensile yield strength of the acetal homopolymer at various temperatures. Note that the calculated limiting stresses at time zero in Figure 3 are approximately the same as the yield stress values. However, as the time frame becomes extended, the allowable stress on the polymer declines. At one year, the allowable working stress for the material has declined by approximately 70% and at 10 years it is only about 25% of the value that would have been sustainable momentarily. Table 2 provides the values that make up selected points in the plots from Figure 3. These extend out to 100,000 hours, the approximate desired lifetime of the assemblies utilizing the gears.
These data serve a number of useful purposes. First, they establish that the real stress on the failed gears, assuming an average operating temperature of 40°C and a time to failure of two years, was approximately 2800 psi, not 10,000 psi, as the linear FEA had calculated. This meant that the redesign had likely reduced the stress on the part to 1700-1800 psi. This should allow for reliable performance over 100,000 hours at a continuous operating temperature of 40°C. The results in Figure 3 and Table 2 also provide a quantitative relationship between time and temperature for a given stress level. This is shown by the horizontal line drawn through the curves in Figure 3.
If we assume that these stress levels will produce failure for the time-temperature combination indicated, then these data provide a means for performing accelerated tests designed to verify the model and the fitness for use of the product over time frames that are impractical to test. For example, Figure 3 shows that the stress level that will cause failure in 10,000 hours (about 14 months) at 50°C will also produce failure in 700 hours (about one month) at 65°C and in about 190 hours, or eight days, at 80°C. This allows the design engineer to perform relatively short-term tests at elevated temperatures to predict time to failure at much lower operating temperatures.
So maybe it is the material . . .
When this exercise was performed for the combinations of time, temperature, and stress that were pertinent to the application, the accelerated tests produced failure in a time frame for the new design that equated to an acceptable lifetime for the product. However, when the same tests were conducted on parts from the old design, the predicted lifetime was four to five years rather than the two years at which the actual failures had occurred.
While this time frame was still unacceptable, these results raised questions about either the model or the actual condition of the gears that had failed. If the model was correct, then the disparity between predicted and actual time to failure would suggest that the material in the parts was in some way compromised and did not possess the properties reflected in the tests that had been performed on standard test specimens. And that is where the processing piece of the puzzle fits. This will be the topic of our third and final installment.
About the Author(s)
You May Also Like

