When a molded part fails, a search inevitably begins for the cause. But there may not be one. That is, there may be several, plus relationships between them that can add layers to the problem.
October 20, 2009
As outlined in the first two parts of this case study, some detailed examination of failed gears as well as a thorough engineering analysis of the stresses in the application and the long-term behavior of the polymer used had produced a reasonable explanation for the root cause of the failures. However, the model used to characterize the material’s long-term properties still predicted a time to failure that was two to three times the actual lifetime of the parts coming back from the field.
|
But models are predictive tools often based on extrapolations of readily available data. Professionals who spend most of their time operating in the theoretical realm have an inordinate amount of trust in models and spend a great deal of time refining the constitutive equations that describe the model, often without seeking adequate experimental verification that the model is correct.
A discerning scientist understands that the best models must capture behavior in the real world and that equations are essentially statements about relationships between inputs and results that can be demonstrated. This approach ensures that models will be based on observation and refined in ongoing evaluations. Becoming overly attached to the model results in a process of fitting data to a pre-existing notion of the way the world works and discarding data that does not fit the model.
Twixt model and result lies the process
In this case we had what could be called reasonably good agreement between predicted and actual behavior, depending on your viewpoint. A theoretician would look at the data used to characterize the long-term behavior of the acetal homopolymer and say that the projection is within the same order of magnitude as the real behavior of the part. But to the engineers responsible for the product, the actual lifetime of the part is 35%-50% of what it “should” have been. This discrepancy can certainly be explained in terms of differences between the relatively perfect condition achieved in a standard test specimen and the “real world” of the actual part geometry. However, things can happen during processing that aggravate this performance gap, and in this case they had not yet been examined.
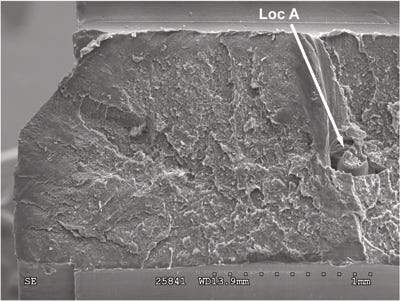
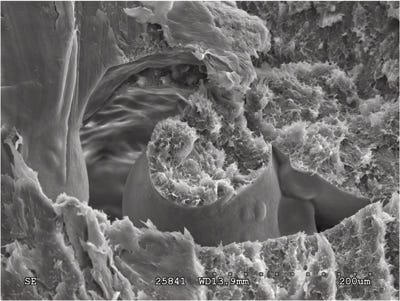
There were some clues that all was not well with the manufacturing process, thanks to some of the high-magnification images of the fracture surface. Figures 1 and 2 show a mid-wall area of the fracture where the structure of the material clearly is not homogeneous. The location of this feature is actually in an area before the step in the diameter of the molded hole that created the stress concentration responsible for fracture initiation. However, features around this anomaly show that the growth rate of the fracture accelerated when it reached this point. The differential rate of cooling around this unmelted or partially melted pellet creates internal stresses and the void around this pellet reduces the effective wall thickness. This alone might have been enough to account for the accelerated rate of failure observed in the field.
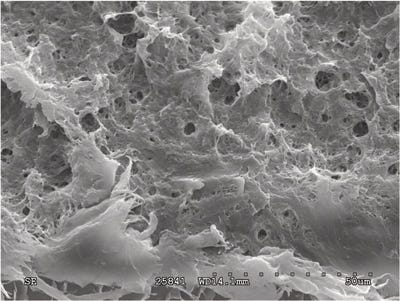
But there is more to this. Figure 3 shows an area of the fracture near the origin that indicates the presence of microporosity. This is a concern because this type of morphology can indicate weakness. In acetals this structure is of particular concern because the polymer has a well-documented tendency to generate a significant amount of gaseous byproducts when processed at elevated temperatures. If these byproducts are entrained within the structure of the molded part, they can produce the type of microstructure seen here. This can indicate the presence of polymer degradation.
|
In most cases, polymer degradation can be verified by some determination of molecular weight. The simplest measurement is made using melt flow rate (MFR) tests. However, in this case the parts were too small to provide a sufficient sample to conduct the test. Typically, the alternative would be a measurement of intrinsic viscosity. This is a test that involves creating a dilute solution of the polymer in the appropriate solvent and requires only a very small sample. A more involved analysis can be obtained by performing gel permeation chromatography (GPC) to provide a complete molecular weight distribution.
However, research has shown that none of these techniques works particularly well when process-induced degradation in acetals is the concern. When acetals degrade during the molding process, the polymer unzips so quickly that there is little intermediate molecular weight material produced. Most of the degraded material has turned to very low-molecular-weight byproducts that are not captured in traditional molecular weight measurements. Consequently, MFR, intrinsic viscosity, and even GPC tests are of little use in detecting the sort of thermally driven degradation that occurs during molding.
The best test to assess this type of degradation is end group analysis using a technique called nuclear magnetic resonance (NMR)—but not many facilities have it. Also, some knowledge of the polymer’s chemistry is needed to make the most of NMR. However, there is an alternative that, while not as strictly quantitative, can be used to distinguish between healthy acetal polymer and polymer that has undergone harsh thermal treatment: thermogravimetric analysis (TGA).
One use of TGA is monitoring weight loss in a sample as a function of increasing temperature. A polymer that has been degraded in a manner that produces gaseous byproducts will tend to trap some of this volatile material in the molded part, as indicated by the structure seen in Figure 3. When a sample of this type of material is heated, it begins to release these byproducts at a temperature that is lower than normal. The measurements are not quantitative; however, with a good baseline to serve as a guide, the results can be used to indicate the likelihood of a problem.
In TGA, a sample is typically heated in an inert atmosphere such as nitrogen or argon so that the weight loss process is not confounded with other reactions such as oxidation. Because an inert atmosphere is used, the temperature at which polymer decomposition begins in a TGA test is usually much higher than the temperature range used in processing.
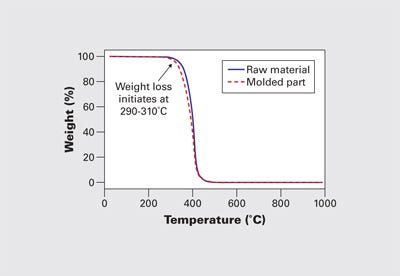
Figure 4 shows an example of the weight loss process for an acetal homopolymer raw material and a molded part. The slight reduction in the weight loss onset point for the molded part can be seen in this graph and represents a typical shift from raw material to molded part. In both cases, the initiation of the weight loss process begins near 300°C. The maximum melt temperature for processing the homopolymer is around 215-220°C, and this difference between the onset of degradation in the TGA and in the molding machine is typical and expected. It is the result of the difference in the atmosphere plus the absence of shear in the analytical instrument.
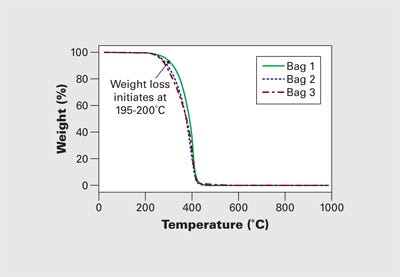
Figure 5 shows TGA results for samples taken from three failed gears. They show a significant reduction in the weight loss onset temperature. The beginning of the weight loss process begins at 195-200°C, a temperature range that is well within the normal processing region. This represents a serious reduction in thermal stability. It is clear that the condition of the polymer in these gears falls short of what is expected or achievable in an acetal homopolymer. These three parts exhibited weight losses between 8% and 25% of the sample at temperatures below the typical decomposition range for acetal homopolymer.
Verification of the unusual condition of this material came from another technique that is typically used to characterize polymers, differential scanning calorimetry (DSC). DSC is a valuable tool for distinguishing between polymer types according to their melting points. This test had been run along with several others to check for contamination. No such contamination was detected; however, part of the process in DSC is to heat the material above its crystalline melting point in order to identify the phase change temperature and the degree of crystallinity.
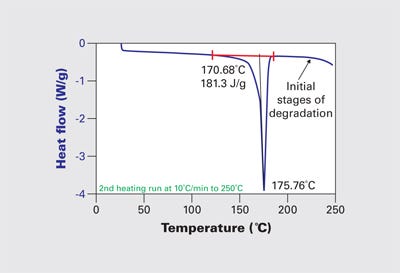
While these properties showed little variation from normal behavior, Figure 6 shows that the baseline beyond the melting event starts to drift downward just above 210°C. Once again, this is abnormal behavior for acetal homopolymer. The downward trend line in the heat flow trace is associated with the vaporization of formaldehyde and other related species. DSC tests are run in a nitrogen atmosphere in an environment free of any shear stresses. For a material to exhibit signs of degradation during these tests at temperatures anywhere near the normal processing range is a clear sign that the material has been compromised.
It may appear to be a contradiction that the polymer exhibits evidence of thermal stress at the same time that the microscopic images show that the material was not uniformly melted. This, however, is not as unusual as might be expected. Achieving a uniform melt temperature across the entire mass of material being delivered to the mold with every shot is not something that happens automatically simply because the temperature controls on the barrel read a particular number. Those who are knowledgeable about screw design will tell you that 50%-80% of the energy required to melt a polymeric material comes not from the heater bands but from the mechanical work of shearing the material. The more crystalline the polymer, the more important this mechanical component becomes. And acetal homopolymer is among the most crystalline of the semicrystalline materials.
So while having a barrel setpoint of 210°C when the melting point of the polymer, as shown in Figure 6, is 175°C may seem like it offers a guarantee of molten polymer, experience shows that it does not. The missing component in the calculation of thermal input requirements is the area under the curve in Figure 6. This is the latent heat of fusion, the additional energy required to change the material from a solid to a fluid. This energy must be supplied in addition to the energy required to raise the temperature of the material from room temperature to the processing temperature. If this energy is not imparted to the material in a homogeneous manner, we experience “unmelt.”
The fact that we have a term for this condition, where solid or semisolid particles of material make it all the way through the injection unit and into the mold, should be an indication of how pervasive the problem is. Because most screws designed for injection molding machines do a relatively poor job of homogenizing the melt, processors are often forced to increase the total energy input into the material without being able to adequately control its distribution. These adjustments usually take the form of an increase in melt temperature or backpressure. If the residence time is relatively long, then this increase in energy input may begin to degrade the polymer without necessarily resolving the problem of unmelt.
When parts fail, there is a tendency to look for a single cause. And everyone usually comes to the problem with an agenda. In this instance, there was plenty of responsibility to go around. Processing, at least in the case of these parts, was less than optimal. But the problem was aggravated by an unfavorable tolerance stack up, a lack of good data about the long-term performance of the material, and an approach to FEA that treated a plastic as though it were a metal. There are many disciplines involved in making a good molded part. None of them are immune from ill-advised short cuts and a lack of attention to detail.
About the Author(s)
You May Also Like

