Sponsored By
Injection Molding
quality dial
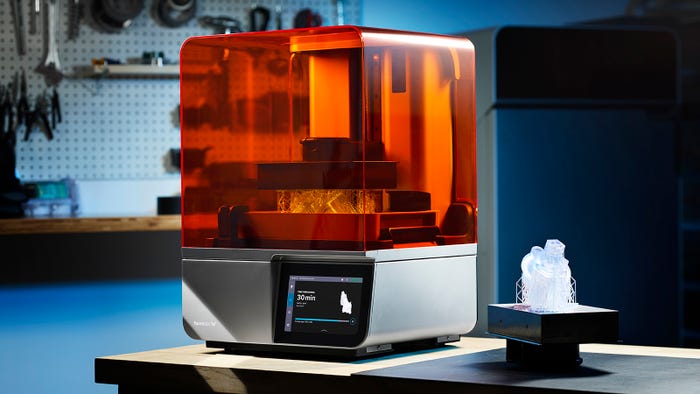
MedicalHow to Optimize Your Medical Injection Molding ProcessHow to Optimize Your Medical Injection Molding Process
To consistently mold components that meet quality control specs and reduce development hours for customers, follow these steps.

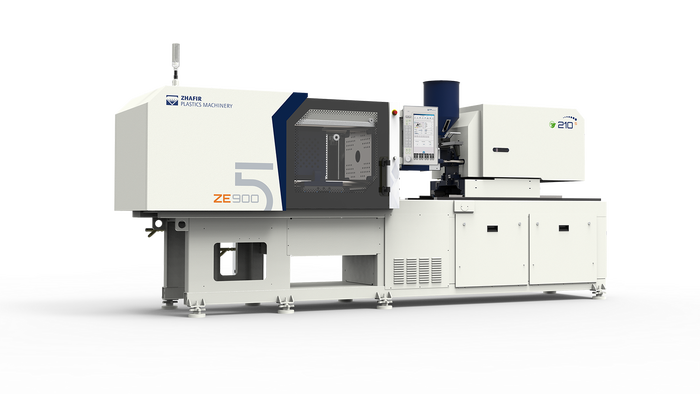


 Demag.")


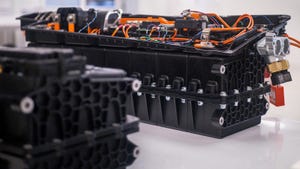
.png?width=300&auto=webp&quality=80&disable=upscale "Medical Molding Outsourcing")


Editor's Choice


Sign up for the PlasticsToday NewsFeed newsletter.