Sponsored By
News
coral reefs
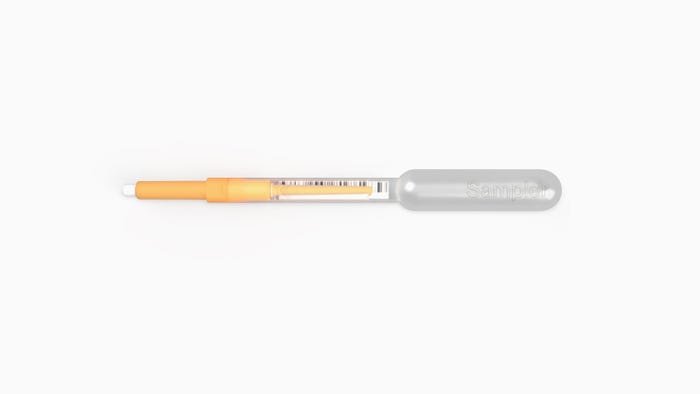
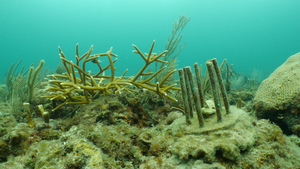
BiopolymersHow Plastic Straws Are Helping to Restore Coral ReefsHow Plastic Straws Are Helping to Restore Coral Reefs
Phade biodegradable drinking straws are being used to build “Coral Forts” that protect newly planted coral from predators.


Editor's Choice


Sign up for the PlasticsToday NewsFeed newsletter.