Even as the number of people employed by the plastics industry in the U.S. declined by roughly 24% from 2005 through 2010, the total value of shipments from the sector rose by nearly one billion dollars, climbing from $301.1 billion to $302 billion, a testament to greater processor efficiency via productivity gains.
December 15, 2011
Even as the number of people employed by the plastics industry in the U.S. declined by roughly 24% from 2005 through 2010, the total value of shipments from the sector rose by nearly one billion dollars, climbing from $301.1 billion to $302 billion, a testament to greater processor efficiency via productivity gains.
That data and more from the Society of the Plastics Industry, which released the findings of two in-depth studies: one addressing the size and impact of the U.S. plastics industry and the other examining global business trends in the plastics industry.
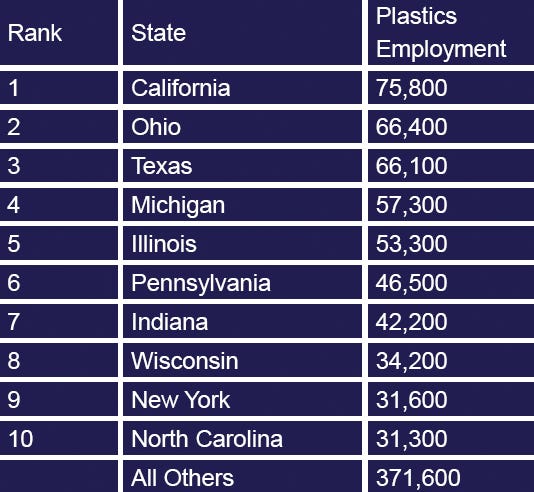
Plastics Employment by State
Bill Carteaux, SPI president and CEO, and Michael Taylor, senior director of international trade, presented a sampling of the studies' findings in a webcast, with Carteaux noting the resiliency of the U.S. plastics industry, which has recently benefitted from strong exports fueled by a weaker dollar and cost-advantaged resin produced from cheap, domestic natural gas.
In 2010, the U.S. plastics industry accounted for more than $341 billion dollars in annual shipments and directly employed more than 876,000 people in over 16,600 facilities, with representation in every state in the union. Overall employment in plastics is declining, however, with 192,132 fewer employees since 2005. Over that same time period, the number of establishments has also shrunk by 8%.
Overall plastics manufacturing employment has been flat since 1980, while the value of shipments has grown 2.4%/yr and productivity expanded by 2.3%. All manufacturing, however, has seen employment slip 1.6% over that same time, while real shipments and real value add grew by only .2% and .6%, respectively, and productivity expanded at a lower rate than plastics: 1.9%.
The rankings of the individual U.S. states in terms of employment changed little over the last five years, with the total number of plastics workers largely tied to each state's population. Generally speaking, the Northeast and the Midwest gave some ground to the South, which has become a greater center of manufacturing in the U.S., driven in large part by the automotive industry.
In terms of plastics employment concentration, or the number of plastics workers/1000 non-farm employees, there were some big movers, with Alabama rising from 20th to 16th, Pennsylvania climbing from 15th to 11th, and Connecticut jumping from 24th to 15th.
The top 10 states in terms of plastics concentration go: Indiana, Michigan, Ohio, Wisconsin, Kentucky, South Carolina, Illinois, Tennessee, Rhode Island, and Iowa. (Ed. Note: Tomorrow PlasticsToday will review the data SPI presented on global trends for plastics, focused on trade flows).
About the Author(s)
You May Also Like


