How better fault detection methods improve molding quality
Statistical process control (SPC) for injection molding consists of setting alarm limits on a few important molding variables for real-time faulty part containment. Multivariate SPC detects process outliers more efficiently by analyzing the correlation structure between multiple dependent variables—often the cause of out-of-spec parts.
December 15, 2009
Statistical process control (SPC) for injection molding consists of setting alarm limits on a few important molding variables for real-time faulty part containment. Multivariate SPC detects process outliers more efficiently by analyzing the correlation structure between multiple dependent variables—often the cause of out-of-spec parts.
Process automation provides significant benefits for injection molding operations. These include improved process consistency, increased productivity, reduced operator interference, and lower labor costs. Unfortunately, quality assurance (QA) can constitute a significant barrier to the implementation of automated processing. Even with highly detailed process characterizations and extensive and continuous monitoring, it may prove difficult or even impossible to achieve the level of process understanding necessary for automated QA.
|
This is a particularly difficult problem when injection molding medical and other tight-tolerance parts. Constant sampling is problematic for these processes and contamination considerations can prevent the operator from inspecting the parts.
QA approaches for these processes typically use univariate analysis (UVA) and monitoring methods such as statistical process control (SPC). In SPC, control charts for multiple process and quality variables are created. These charts are individually reviewed to detect out-of-spec parts and to identify any process parameter changes that may improve the quality. Unfortunately, such techniques are not adequate for automated QA and often allow defective parts to be released by the manufacturing operations. Much more effective methodologies for automated QA are available that employ multivariate analysis (MVA).
MVA is a statistical design tool that is effective in dealing with large data sets. It is a relatively new approach for the injection molding industry, but recent research suggests that it can provide significant improvements over existing methods of online fault detection. MVA does not attempt QA predictions based solely on multiple upper and lower single-variable limits, but rather considers the correlation structure and relationships that exist between all of the variables being monitored and modeled. MVA currently is well accepted in numerous other industries.
While different approaches for multivariate analysis exist, one of the most effective for injection molding fault detection is known as principal component analysis. PCA measures the correlation structure among the different observations in a data matrix, and then uses a projection method to provide a set of new latent variables called principal components, which are linear combinations of the various measured process variables. The principal components are created such that they explain as much variation in the data set as possible and allow for improved visualization of an entire system. The output of the PCA analysis results in a reduced set of summary statistics that can be used to more easily evaluate the process and perform QA.
Preventing false alarms
SPC measures the consistency of a process by comparing individual variables to their upper and lower control limits, which are derived from an historical calculation of standard deviation (often three-sigma) above or below the calculated average or range for the variable of interest. This methodology is often used to make accept-or-reject decisions based on where data points fall relative to the upper and lower control limits.
However, the use of this approach for a robust and highly accurate fault detection system has significant limitations. It has serious difficulties effectively interpreting complex process/quality data. Numerous process variables must be charted and monitored in order to ensure process stability, and it can be extremely difficult to detect trends and patterns in the resultant multitude of single-variable charts. This problem is particularly acute for molders since, even though an injection molding process may have certain known variables critical to common defects, many other types of product defects may occur that are not easily observed by SPC methods.
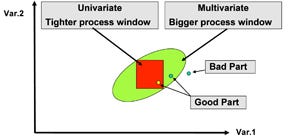
Also, a molder that relies on SPC for fault detection must carefully decide on the number of individual variables to monitor and must choose their appropriate univariate limits. These limits can be set very tightly within the control space or they can be set sufficiently broad to accept product from a process that is statistically “out of control,” as defined by the univariate process window (Figure 1). The choice of limits varies by application, but tighter limits are generally preferred for SPC. Unfortunately, this option generates many false alarms.
False alarms are an ongoing problem for injection molding operations that use inline SPC tools for QA. SPC QA methods that depend on univariate upper and lower control limits are not consistent in their determinations of when a process is out of control, primarily because univariate monitoring and real-time fault detection do not evaluate the interactions and relationships between the variables in a process.
Correlated variables
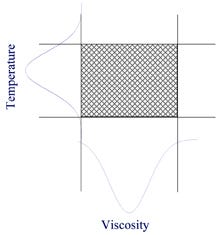
Consider two variables such as temperature and viscosity. As Figure 2 shows, when the upper and lower control limits for these variables are overlaid, they create a box that represents the process window for “in control” operation. For a part to have acceptable quality and be accepted by the QA procedure, both process variables—temperature and viscosity—must have exhibited a value within this box during the part’s manufacture. Conversely, when the value of either process variable lies outside of this box, the parts that are produced under these conditions are rejected since the process is assumed to be “out of control” and therefore producing out-of-spec product.
This approach to QA works well when dealing with a process in which the variables are uncorrelated or independent of each other. However, if the variables are correlated (for example, viscosity and temperature, which are highly correlated in an injection molding process), the “in control” space is not solely defined by the simple box-like space shown in Figure 2. This greater complexity of the process window must be considered for accurate fault detection involving correlated variables. Multivariate fault detection considers the relationships between variables in defining the process window for “in control” production, resulting in a highly effective method for real-time fault detection of injection molding processes.
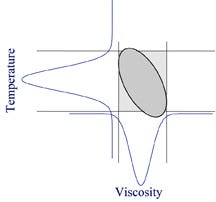
Multivariate analysis for fault detection defines variable acceptance and rejection limits differently from univariate SPC. Figure 3 shows how a multivariate system treats two correlated variables such as temperature and viscosity. As we know, higher melt temperatures result in lower melt viscosity. Similarly, lower temperatures result in a high-viscosity melt. The “in control” space must therefore be changed to accommodate this relationship. For an injection molding process, this alters the shape of the “in control” process window from the box defined by univariate SPC to an oval that accounts for the relationship between viscosity and temperature.
Using univariate SPC QA methods, parts would be considered acceptable if they were produced when the temperature and the viscosity were near but still within the high control limits of both variables. The “in control” process window for the case in which temperature and viscosity are correlated (shown in Figure 3) indicates that, in fact, these parts were produced under conditions that lay outside of the “in control” process window and should therefore be rejected. QA methods that employed a multivariate control space would recognize this and reject the associated part.
This multivariate approach of defining a more accurate “in control” space leads to a significant decrease in the number of false alarms. The number of false alarms in a UVA is strongly correlated with both the tightness of the control limits and the number of monitored variables.
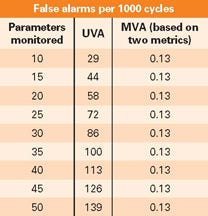
Table 1 displays the calculation of false alarms per 1000 observations for UVA vs. MVA when different numbers of variables are monitored. The disparity between the two methods is substantial. When univariate SPC is used, the false alarm rate increases by 29, over a period of 1000 observations, for every 10 variables added to a monitoring or fault detection system. For a multivariate system, however, the false alarm rate does not increase as more variables are added to the system. This ability to observe and closely monitor many variables in a system provides a tremendous amount of power and knowledge, and is one of the key benefits of MVA. This increased knowledge about the system and process allows the user to find the root cause of the problems more quickly.
How do you use it?
Multivariate analysis for quality assurance in injection molding can be applied in a variety of ways. The most common approach for online multivariate fault detection uses the PCA method mentioned previously. Here’s how it works:
• Acquire the key and available process inputs from the system.
• Determine and calculate the most important features or variables: cushion, fill pressure, injection velocity, viscosity, barrel temperatures, screw displacement, injected volume, etc.
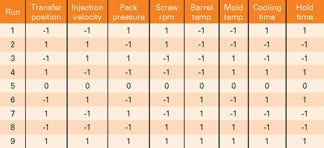
• Create a multivariate model of a known acceptable process window. Design of Experiments (DOE) methods are often used to provide effective and robust multivariate models (a commonly used DOE can be seen in Table 2).
• Perform a multivariate validation and analysis on each cycle against the known model.
• The analysis will determine whether the cycle should be accepted or rejected and the appropriate part containment control action should be taken.
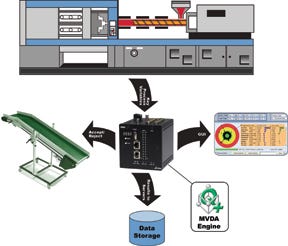
Figure 4 shows a graphical representation of an MVA quality assurance method setup for an injection molding application.
MVA quality assurance methods have been used successfully in a variety of molding applications over the past few years and have proven to provide excellent fault detection results. The benefits of MVA over SPC are well known and well documented, not only for injection molding and plastics manufacturing, but also for many other industrial manufacturing applications. The use of MVA for fault detection in injection molding will continue to grow as competitive forces and increasing demand for enhanced process technologies and innovation drive the need to continuously improve manufacturing results.
References
1. D.O. Kazmer, S. Westerdale, and D. Hazen, “A comparison of statistical process control (SPC) and on-line multivariate analyses (MVA) for injection molding,” International Polymer Processing, vol. 23, pp. 447-458, 2008.
2. C.A. Ambrozic and L. Hutson, Multivariate analysis (MVA) for quality detection in injection molding systems in the medical device community, Annual Technical Conference–ANTEC, Conference Proceedings, 2006.
3. D.R. Hazen and D.O. Kazmer, “Using multivariate process analysis to predict injection molded part quality,” Injection Molding Magazine, October 2008, pp. 50-54.
4. D.R. Hazen and D.O. Kazmer, Multivariate process analysis for the prediction of injection molded part quality, Annual Technical Conference–ANTEC, Conference Proceedings, 2007.
5. R.L. Mason and J.C. Young, “Multivariate thinking,” Quality Progress, April 2004, pp. 89-91.
6. L.H. Chiang, R. Leardi, R.J. Pell, M.B. Seasholtz, “Industrial experiences with multivariate statistical analysis of batch process data,” Chemometrics and Intelligent Laboratory Systems, vol. 81, pp. 109-119, 2006.
7. S.E. Eggen, QC of polyolefin manufacturing by rheology and multivariate analysis, Annual Technical Conference–ANTEC, Conference Proceedings, 2005.
Author Daniel Hazen is product manager for the controls product group at MKS Instruments (Austin, TX).
About the Author(s)
You May Also Like
