The Materials Analyst, Part 113: The myth of standardization
If you wish to hold on to the belief that the information on a data sheet is straightforward and simple, read no further.
January 20, 2010
If you wish to hold on to the belief that the information on a data sheet is straightforward and simple, read no further.
The other day I was driving behind a car with a bumper sticker that read, “Eschew obfuscation.” It is funny in a National Public Radio sort of way in that, even if you are not willing to admit it, your appreciation of the ironic humor is enhanced by your self-satisfaction with the fact that you don’t have to look up the words to get the joke. But as I thought about the quip, I started to reflect on an e-mail I had received earlier in the week from a colleague in Asia who was tasked with selecting from different grades of SAN based on data sheet values. The focus of the evaluation was the melt flow rate (MFR) number on data sheets for three different resins.
|
For reasons that are probably lost to history, there are three different conditions used to measure the MFR of styrenic materials such as polystyrene, SAN, and ABS. They all involve different temperatures and loads. Obviously, temperature changes will induce inherent variations in the viscosity of the polymer. But the difference in the loads also plays a part in the measurement since the higher loads produce a greater shear stress on the polymer. This will induce a shear-thinning effect that interacts with the temperature differences.
In this particular case, one resin had a nominal published MFR of 5 g/10 min when tested at 200°C with a constant load of 5 kg. The second material had a nominal MFR of 18 g/10 min when tested at 230°C with a constant load of 3.8 kg. And the third material had an MFR of 53 g/10 min when tested at 220°C with a constant load of 10 kg. The problem was how to tell if these materials were really as different as the numbers suggested.
There are two reasons to be concerned about the MFR of a raw material. The more important and less understood of these is the relative relationship between MFR and the average molecular weight of the polymer. Assuming that all other aspects of composition are relatively constant, the higher the MFR, the lower the average molecular weight of the polymer in the compound. This is important to product performance since molecular weight governs a large number of short-term as well as long-term properties including impact resistance, fatigue endurance, and resistance to creep and environmental stress cracking. A second concern that often takes center stage in the mind of the processor is the approximate relationship between MFR and the ability of the material to fill the prescribed part shape.
Assembling the information
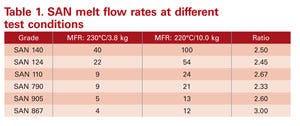
Given the importance of this property, the difficulty in arriving at a conclusion regarding the fitness for use of these materials is significant. If you do enough digging into databases that contain information on enough materials, it is possible to piece things together. Often, material suppliers will characterize the MFR of their materials at more than one of these three test conditions. Table 1 shows published nominal MFR values for several SAN materials that have been tested at both 230°C with a constant load of 3.8 kg and 220°C with a constant load of 10 kg.
Note that the ratios are not consistent. The differences between the methods tend to be greater with the lower-MFR materials. This is because as the MFR numbers decline, the effective shear rates at which the tests are conducted become lower and the changes in viscosity produced by these different shear rates become greater.
|
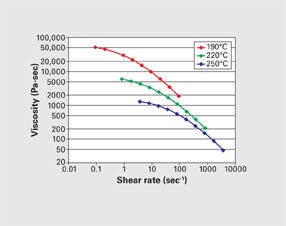
To understand this principle it is necessary to understand the effect that shear rate has on the viscosity of a polymer. Figure 1 shows the viscosity vs. shear rate relationship for an SAN with the same MFR as the SAN 790. The plots show that SAN, although an amorphous resin, has reasonably good shear-thinning properties. At all three temperatures shown on the plot, the viscosity of the material declines by a factor of 27 across three orders of magnitude in shear rate. However, a close examination of the plot details shows that most of this viscosity reduction occurs in the lower-shear-rate region.
|
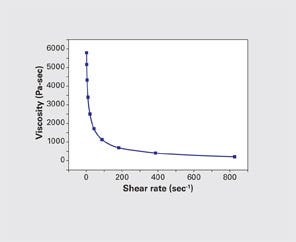
The log-log plot that is traditionally used to display the viscosity/shear-rate relationship masks this fact, but replotting the data using linear axes for any one of these temperatures shows that the viscosity changes very rapidly in the low-shear-rate region of the curve and then levels off at higher shear rates. This is shown in Figure 2. MFR tests are run at low shear rates, typically between 10 and 100 sec-1, in the steep-sloped portion of the curve in Figure 2. As the MFR increases, the shear rate associated with the test also increases. Therefore, the higher the MFR numbers are, the less the difference will be between them.
Don’t forget density
Even with all of these fine points to consider, it can be seen that the ratios of MFRs generated at the two conditions fall into a consistent range, and an average offset of 2.6 is a reasonable conversion factor. This takes care of two of the three methods. Continued digging through the databases will occasionally reveal a material that has been tested at both 200°C with a constant load of 5 kg and 220°C with a constant load of 10 kg.
Unfortunately, the results are not directly comparable. The results for the 200°C with a constant load of 5 kg are for melt mass flow rate given in g/10 min. The results produced using 220°C with a constant load of 10 kg are given as melt volume flow rate (MVR). In order to equate the two, it is necessary to know the density of the material in the molten state. So before you start multiplying the MVR value by the specific gravity of the material provided in the data sheet, remember that this is the density of the material in the solid state. When materials change from solid to fluid, their densities also change. And with few exceptions, the density in the fluid state is lower than that of the same material in the solid state.
Melt density is such an important property that it would make sense for material suppliers to publish it as part of the data sheet. But they don’t. So you have to do even more investigation into the literature or have this property actually measured, something that can be done with the MFR tester if you are fortunate enough to have one available. If not, a good approximation can be made for unfilled amorphous resins by multiplying the solid density of the material by 0.9.
The density of SAN can vary slightly depending upon the acrylonitrile content, but 1.08 g/cm3 is a typical value and this translates to a melt density of 0.97 g/cm3. But before you perform your calculations, the material suppliers have found yet another obstacle to confound your efforts. They have provided the MVR not in cm3/10 min but in3/10 min. The conversion from cubic inches to cubic centimeters involves multiplying by 16.4.
Conversion roadmap
Now we are ready to unveil the relationship between the two methods. A material with an MFR of 1.5 g/10 min determined at 200°C with a constant load of 5 kg gives an MVR of 1.04 in3/10 min, which converts to 16.64 cm3/10 min, which in turn converts to 16.17 g/10 min. So the ratio between the two methods is about 10.8:1. And by inference we can now establish that the ratio between the method using 200°C with a constant load of 5 kg and the method using 230°C with a constant load of 3.8 kg is approximately 4:1. Confused yet? Good; you should be.
Returning to our original problem: How do we then interpret the MFR data for the three SAN materials my colleague in Asia is puzzling over? Well, a 5-melt resin tested at 200°C with a constant load of 5 kg should produce a result of approximately 20 g/10 min at 230°C with a constant load of 3.8 kg and 52 g/10 min at 220°C with a constant load of 10 kg—which is to say that these three materials are essentially the same when it comes to the consideration of average molecular weight, despite the apparent differences suggested by the numbers.
Does it have to be this hard? We are supposedly working in a time when the drive to standardization of methods and practices is the order of the day. Companies have collectively spent billions on the process of converting to international standards. Why, then, do material suppliers not join in the process and make every effort to produce data sheets that lend themselves to a simple comparative analysis? The fact is that they have a long way to go. So until the day arrives somewhere out in the future when every resin supplier is performing their tests using harmonized methods, remember to read the fine print when you look at properties on data sheets and be prepared for plenty of obfuscation.
About the Author(s)
You May Also Like


